Role
As a Design Intern at Morningstar, I designed internal and external assets for the Equity, Credit & Research teams.
Challenge
In my first design role, I quickly adapted to client needs, serving as the sole design resource for multiple teams.
We served financial advisors, asset managers, and individual investors, each with distinct needs.
Process
I collaborated with stakeholders to brainstorm and present concepts, iterating based on feedback to launch client-facing materials.
Timeline
2 Years, May 2010 - June 2012
"It is quite clear that Dan is extremely passionate about his work and he truly does a phenomenal job. Dan put together materials for my group on a tight deadline and made sure it was exactly what we wanted. He is diligent and very precise with his work. It is a pleasure working with him and I am very confident that Dan will exceed expectations in any future role."
Todd Serpico, Director of Global Business Coding, Morningstar
Graphic and Print Design
Analyst Research Center User's Guide
Scope
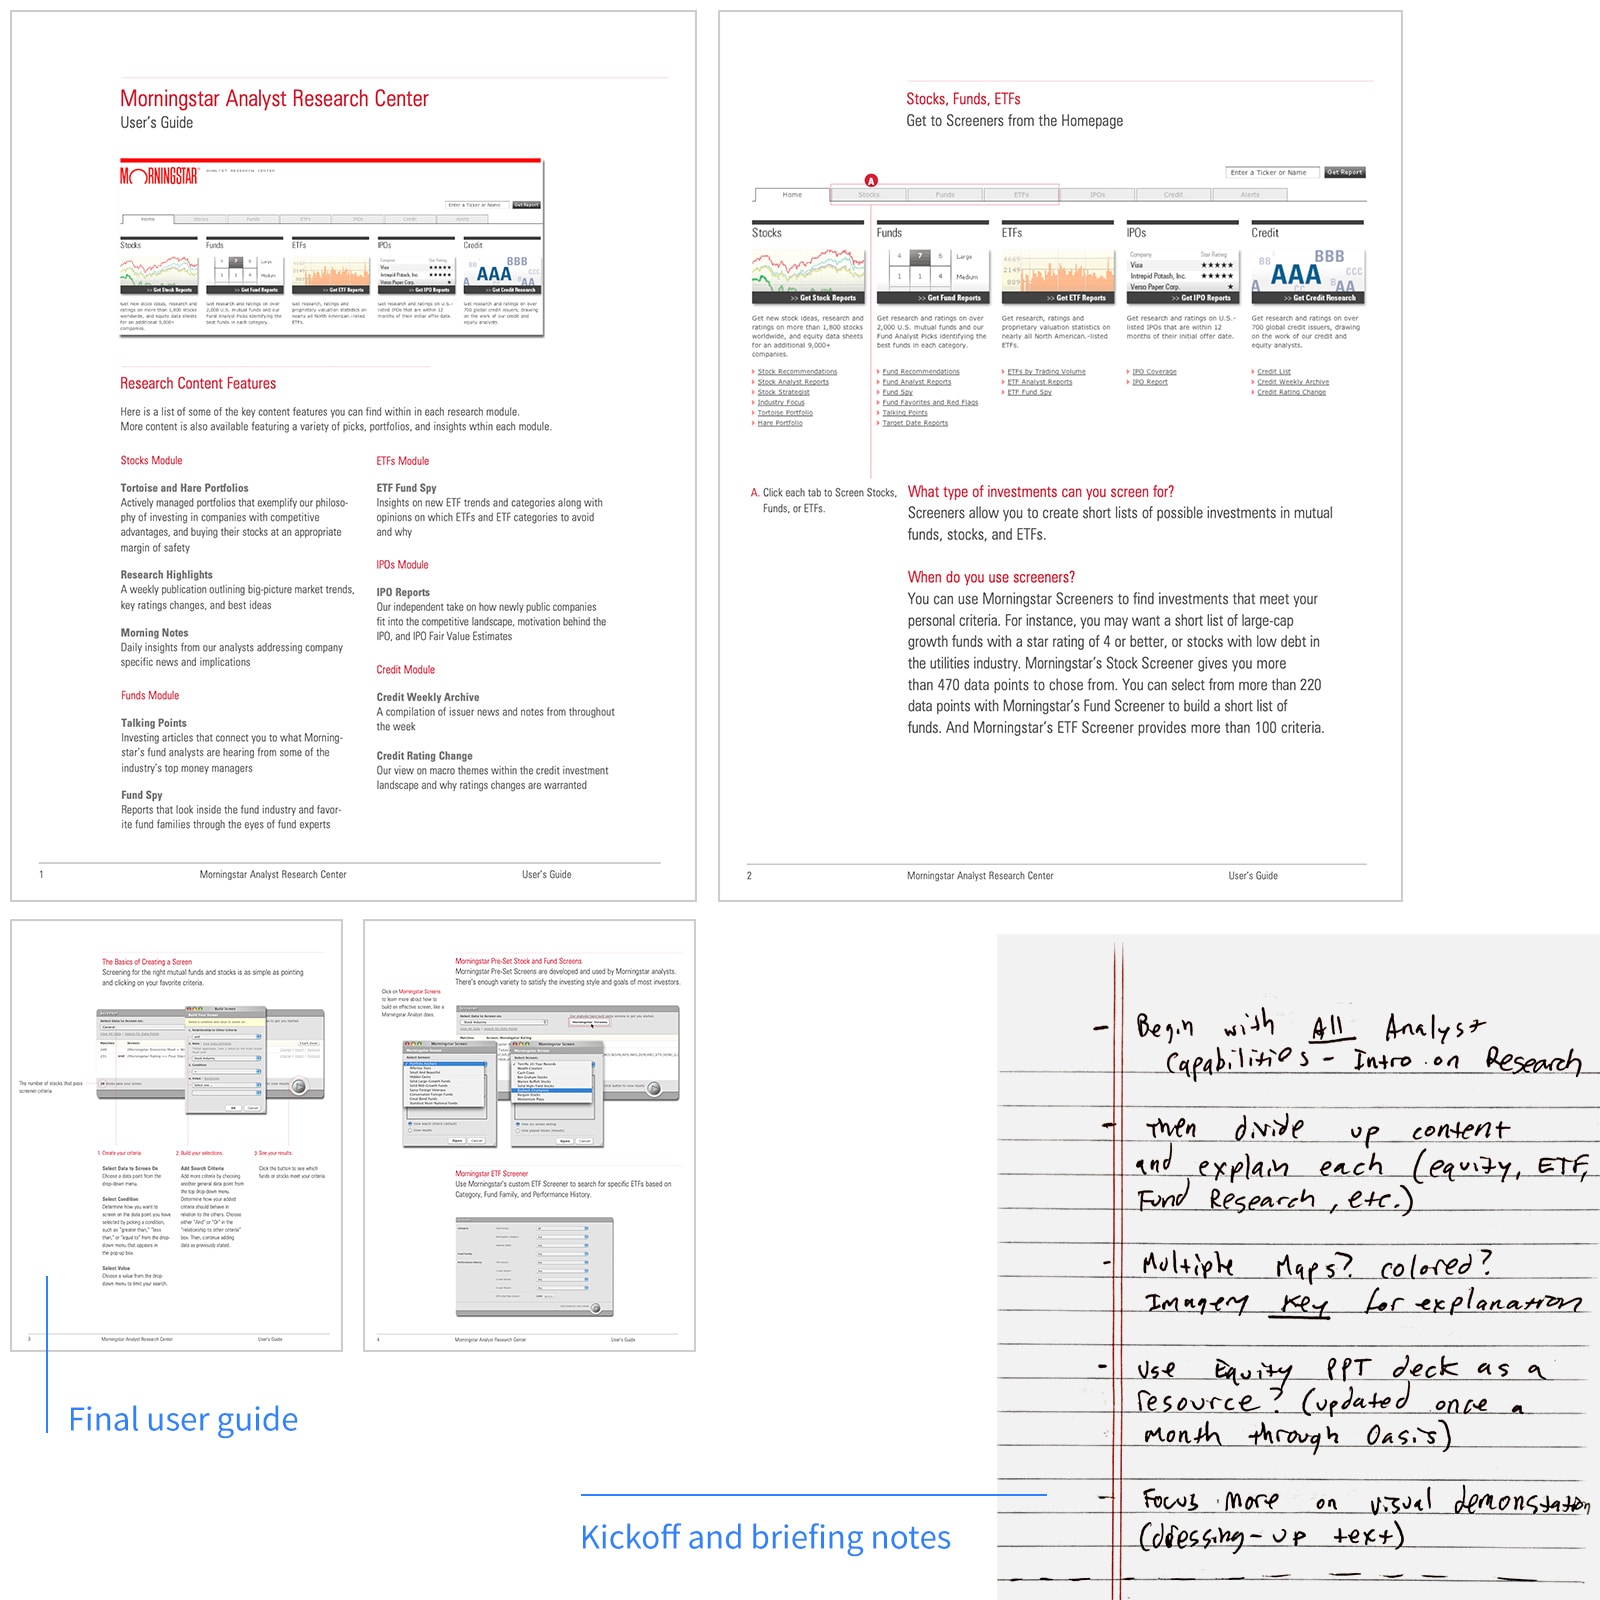
My first assignment was redesigning the user guide for the Analyst Research Center (ARC), our internal tool.
Auditing and Gathering Resources
In parallel, we audited the existing component library to identify gaps and inconsistencies.
I audited the existing guide, finding inconsistencies and readability issues. I incorporated new content and FAQs derived from user feedback.
Construct Grid and Hierarchy
I designed a customized 4-column grid in InDesign and established a visual hierarchy:
- Title, subtitle, short descriptor
- Snapshot/image of the ARC tool
- Image guide callouts
- FAQs and descriptive content
- Footer with page number/context
Review, Iterate, and Publish
After internal review and iteration, we published the ARC User's Guide in print and digital formats.
Management Behind the Moat Ad
Scope
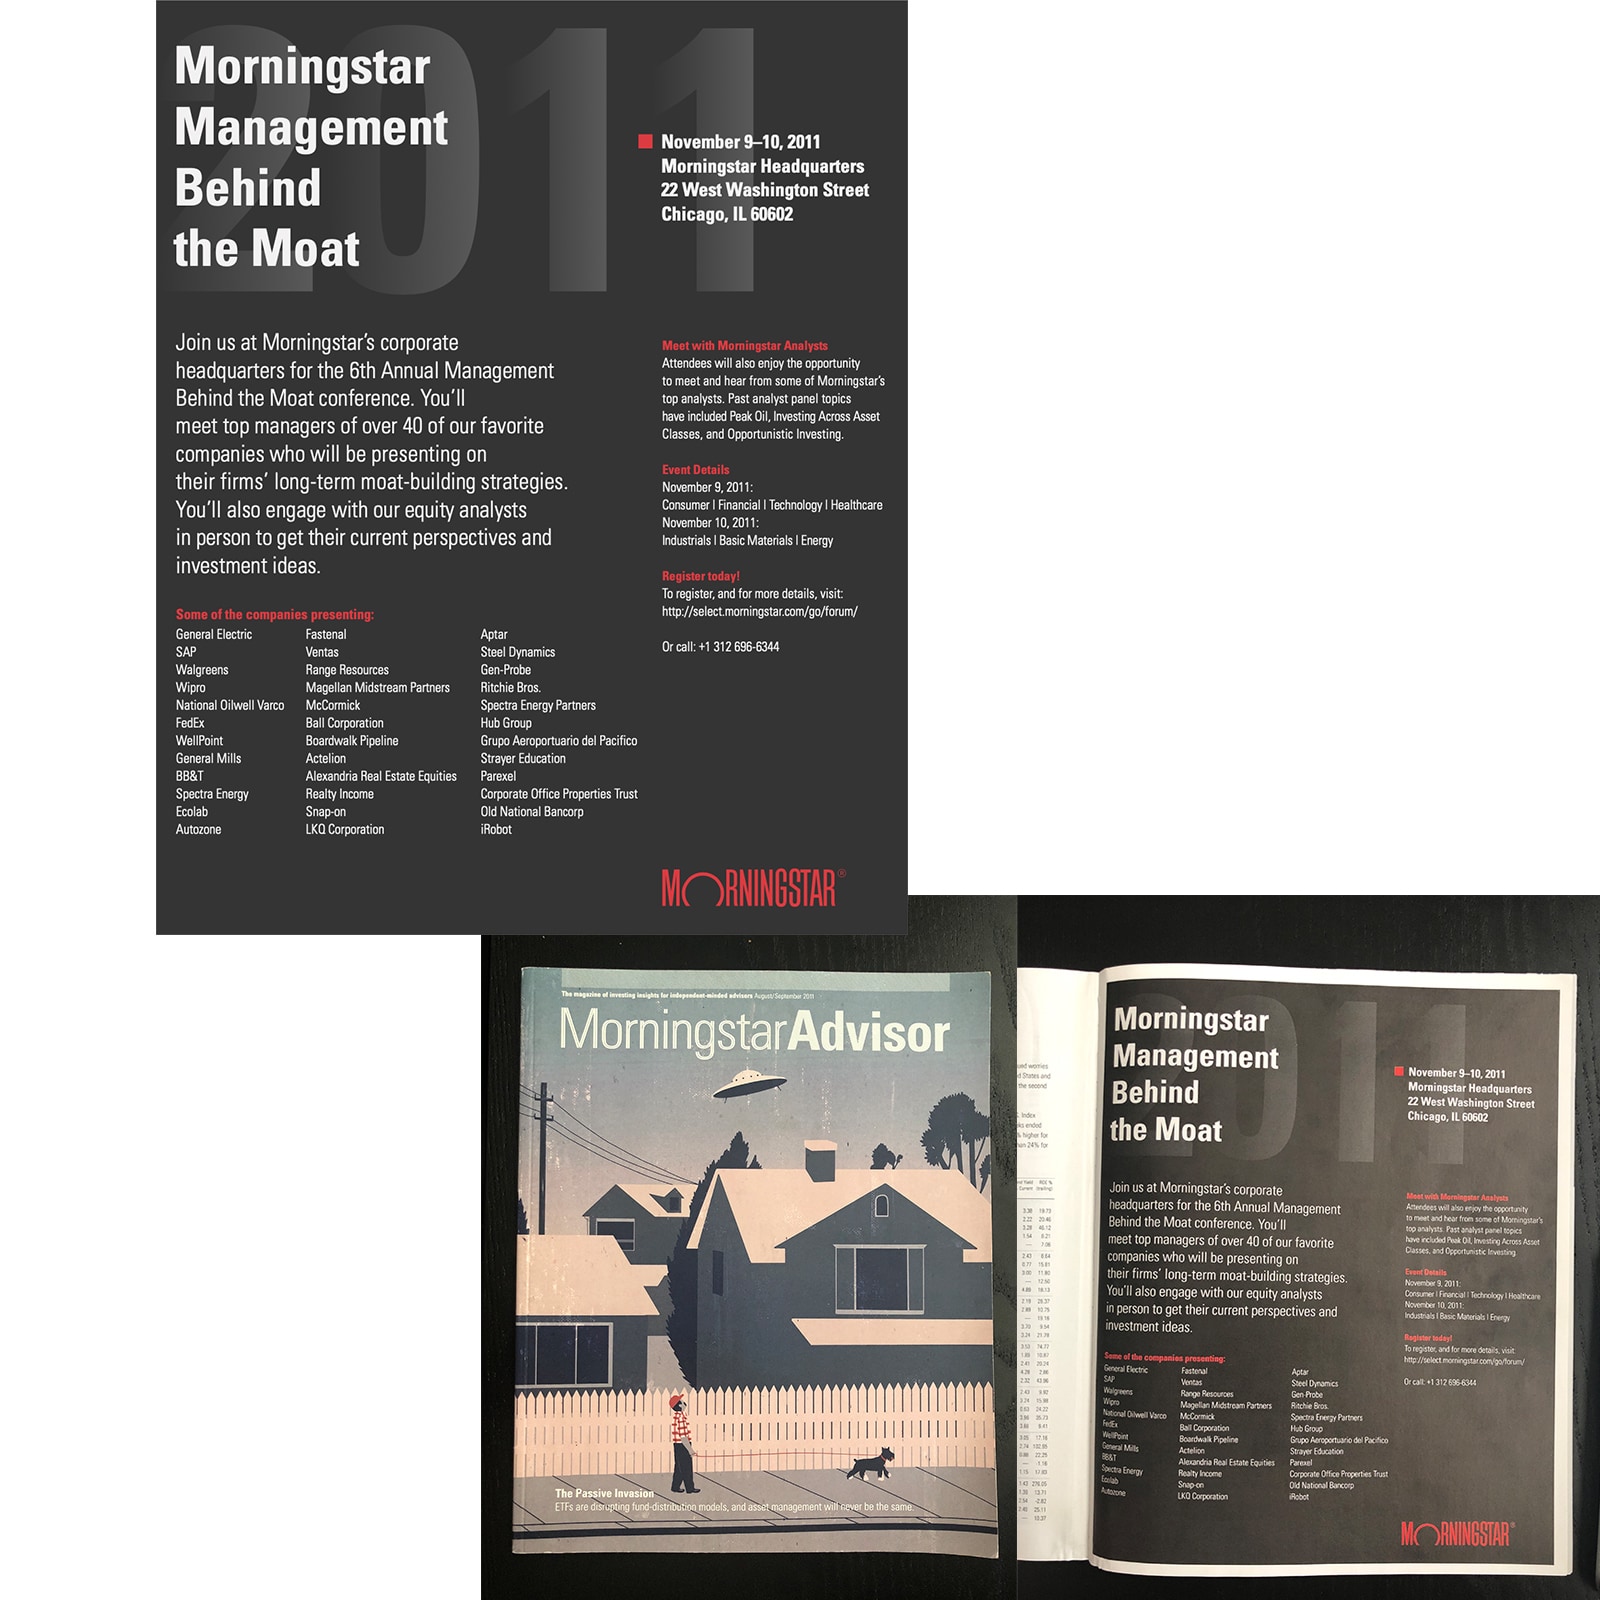
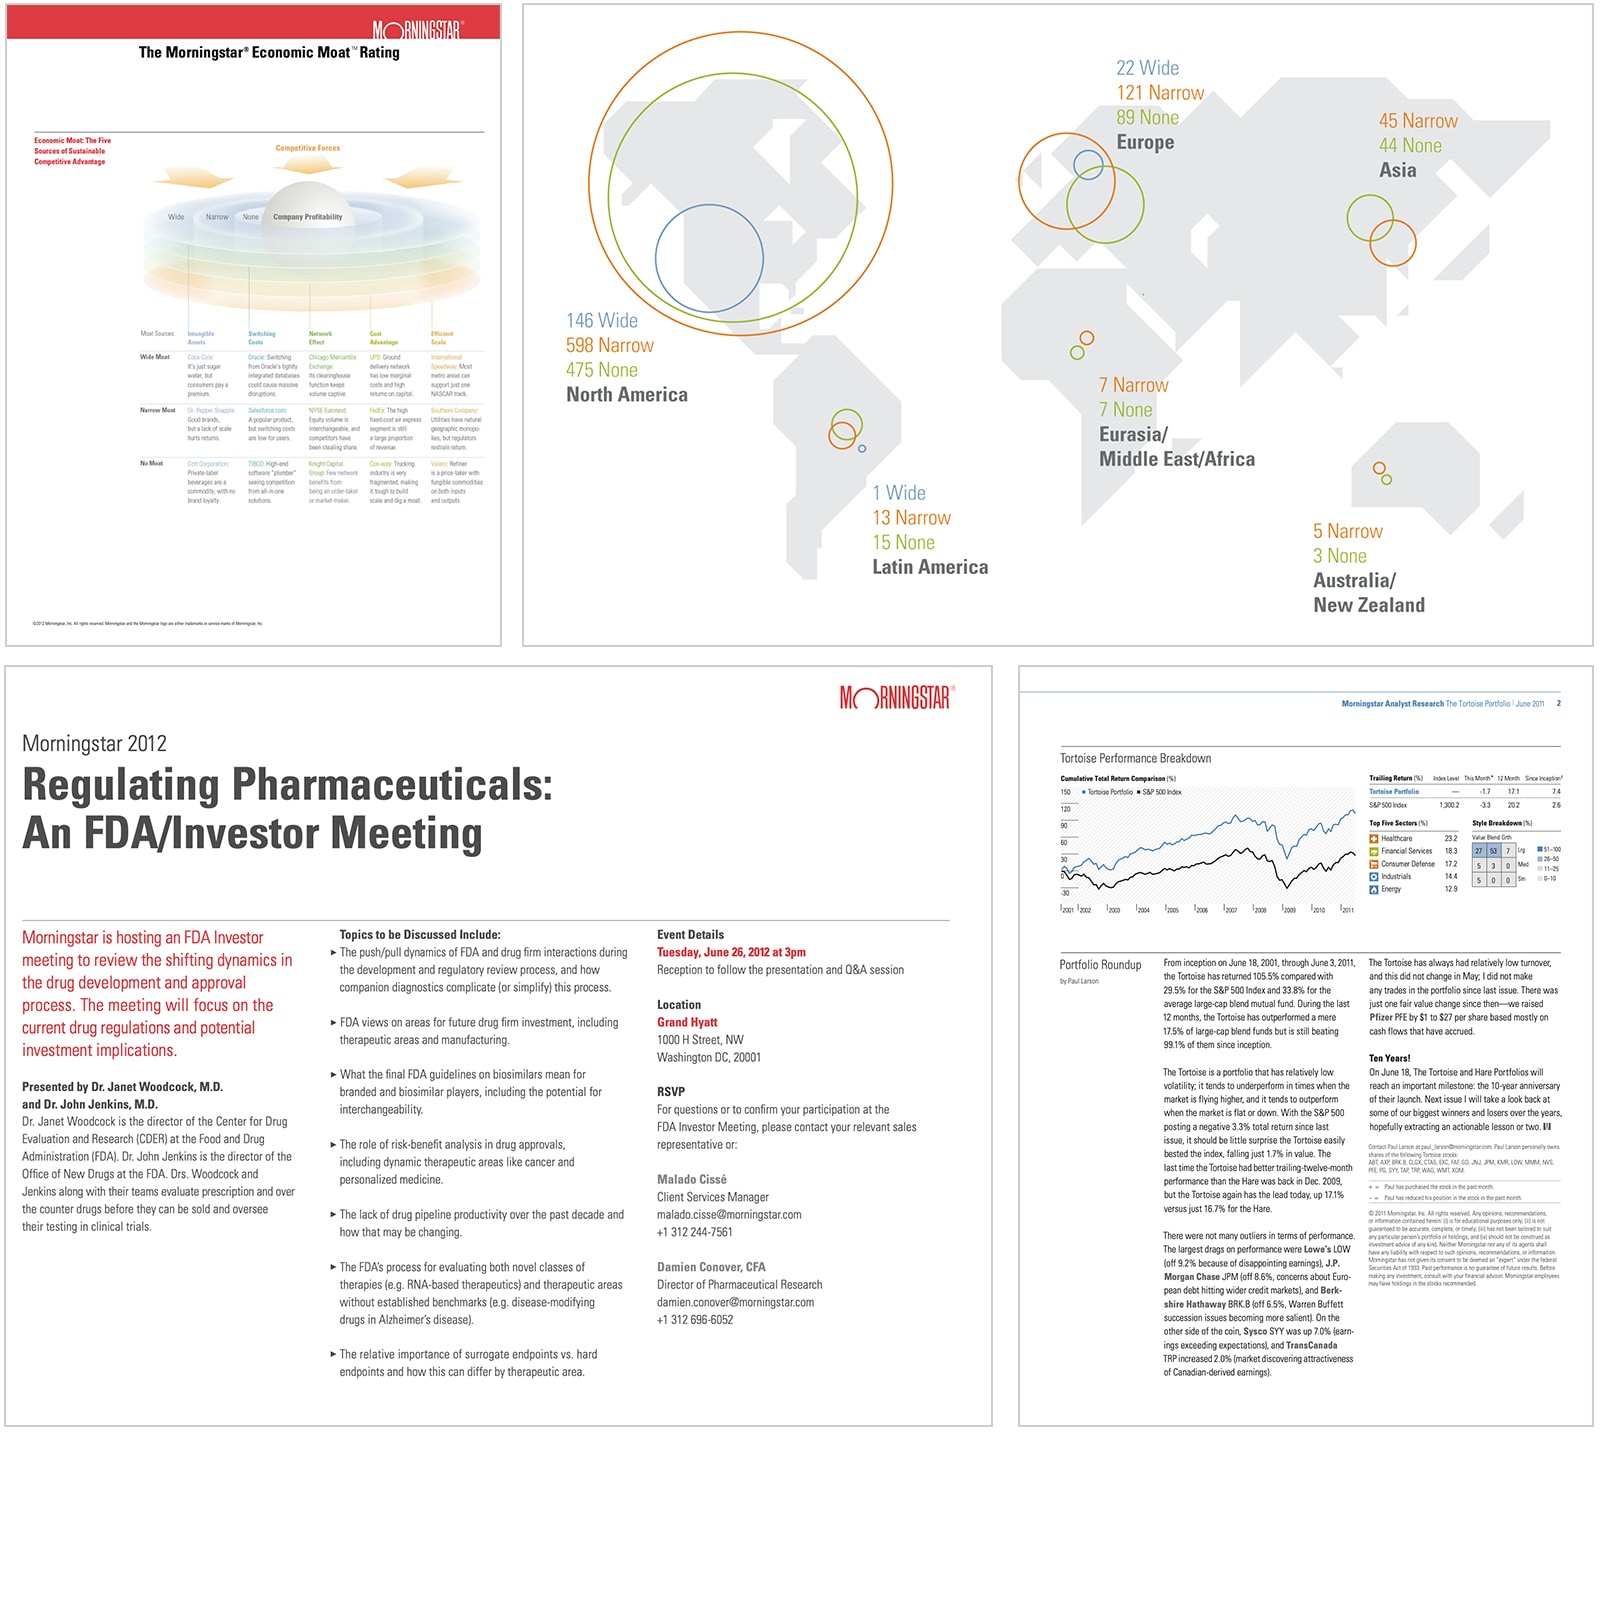
I designed a full-page ad for the Management Behind the Moat conference in Morningstar Advisor magazine.
A Different Approach
I highlighted the event title, year, and location, exploring a high-contrast design that stood out from the magazine's lighter pages.
Construct Grid and Hierarchy
I created a grid emphasizing top and left-aligned content for easy scanning:
- Title, year, location
- Description
- Bullets, micro details
- Participant list
- Company logo
Review, Iterate, and Publish
Stakeholders initially questioned the bold design, but I argued it paved the way for future experimentation. We published the ad after minor tweaks.
Equity & Credit Resource Center Banners
Scope
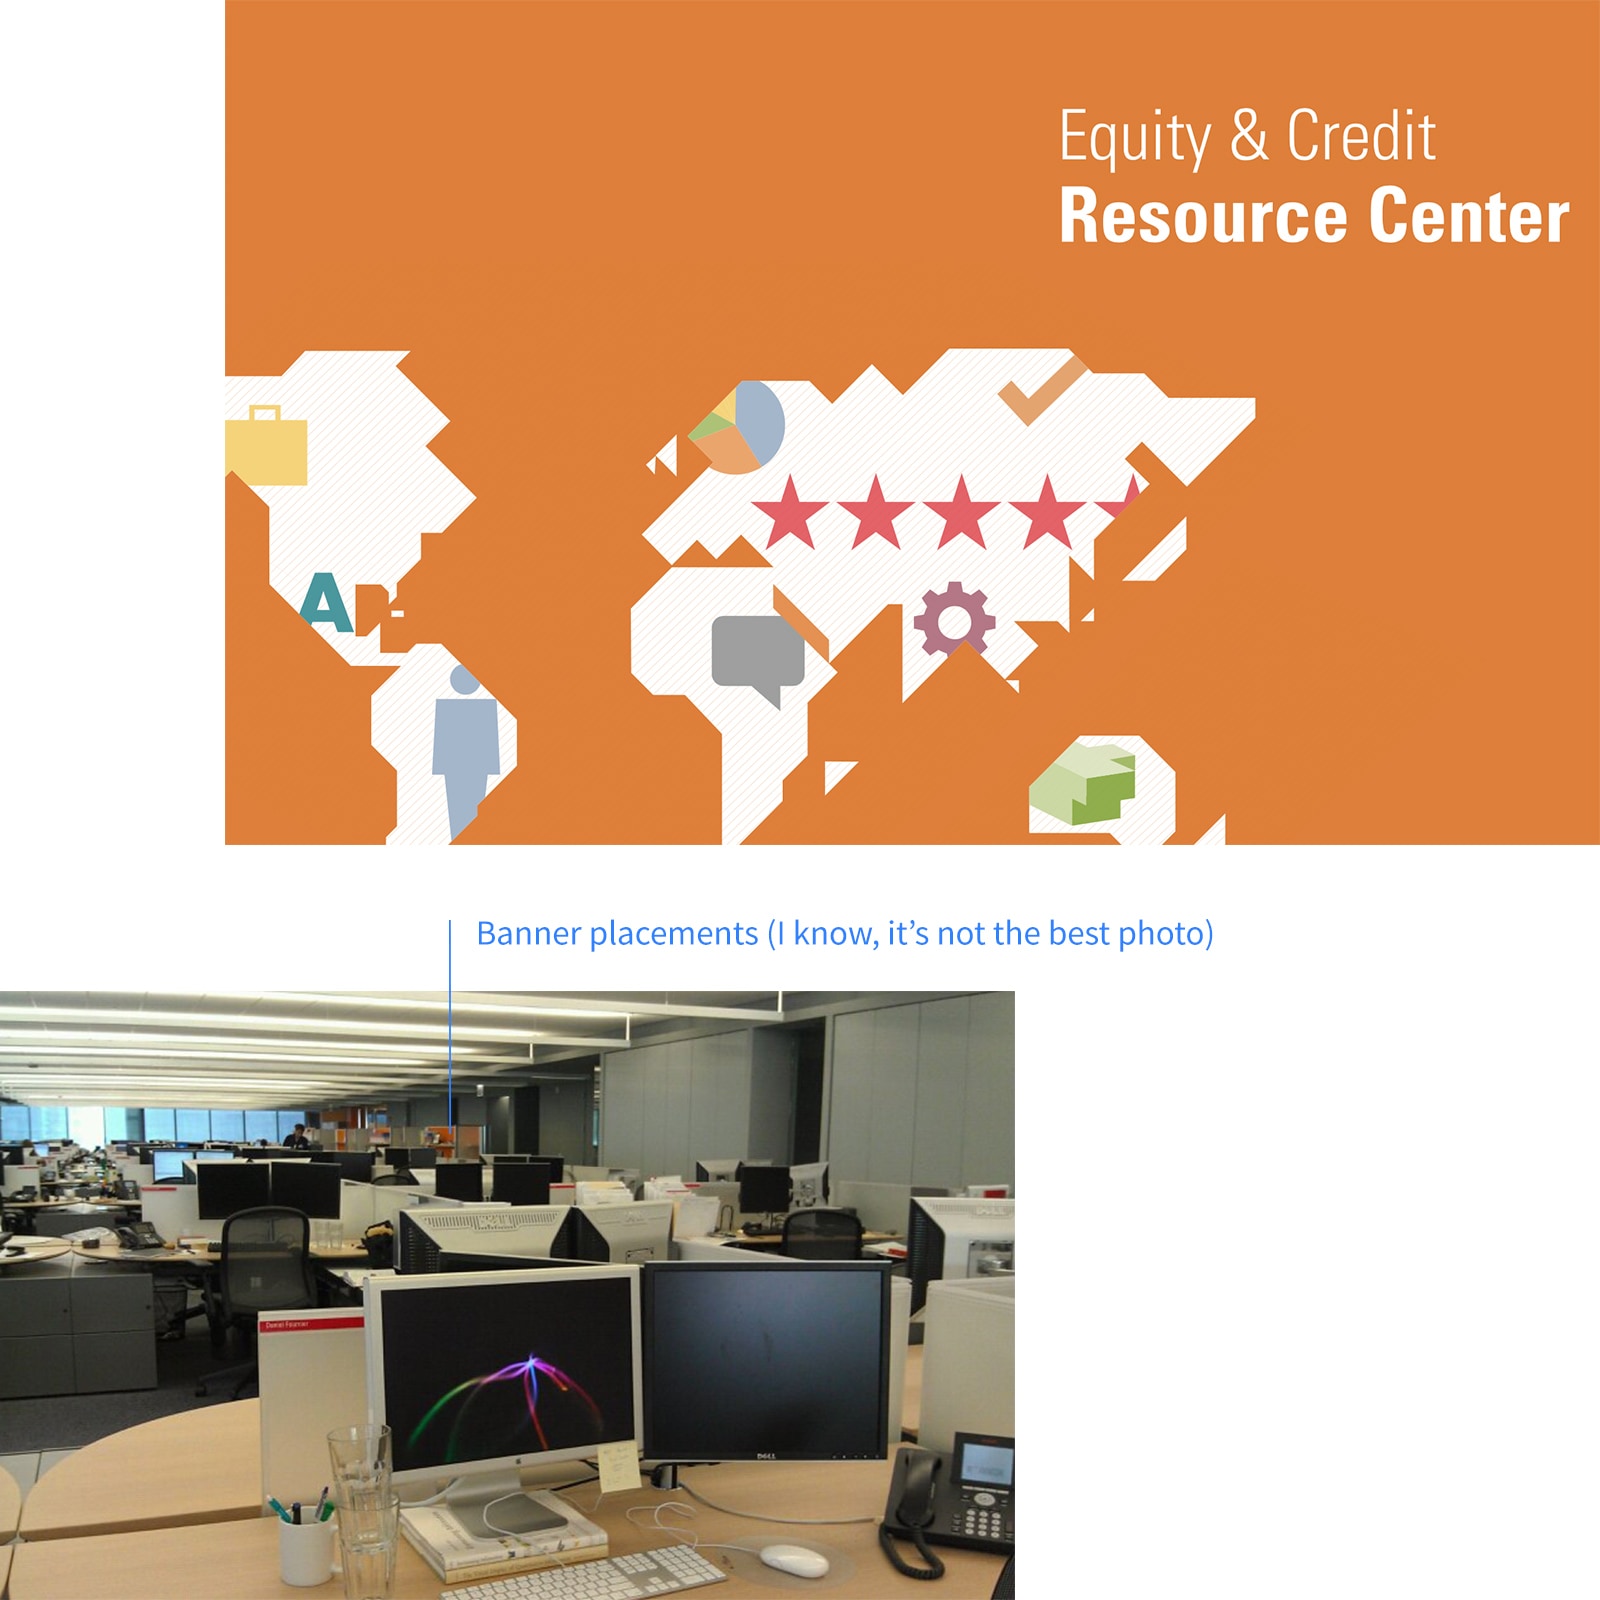
We needed a central location for printed resources. I designed a banner to designate "the island" workspace as the new Equity & Credit Resource Center.
Design & Purpose
I used Morningstar's map and financial iconography against a bright orange background to create an eye-catching banner.
Oil & Gas Insights Monthly Report
Scope
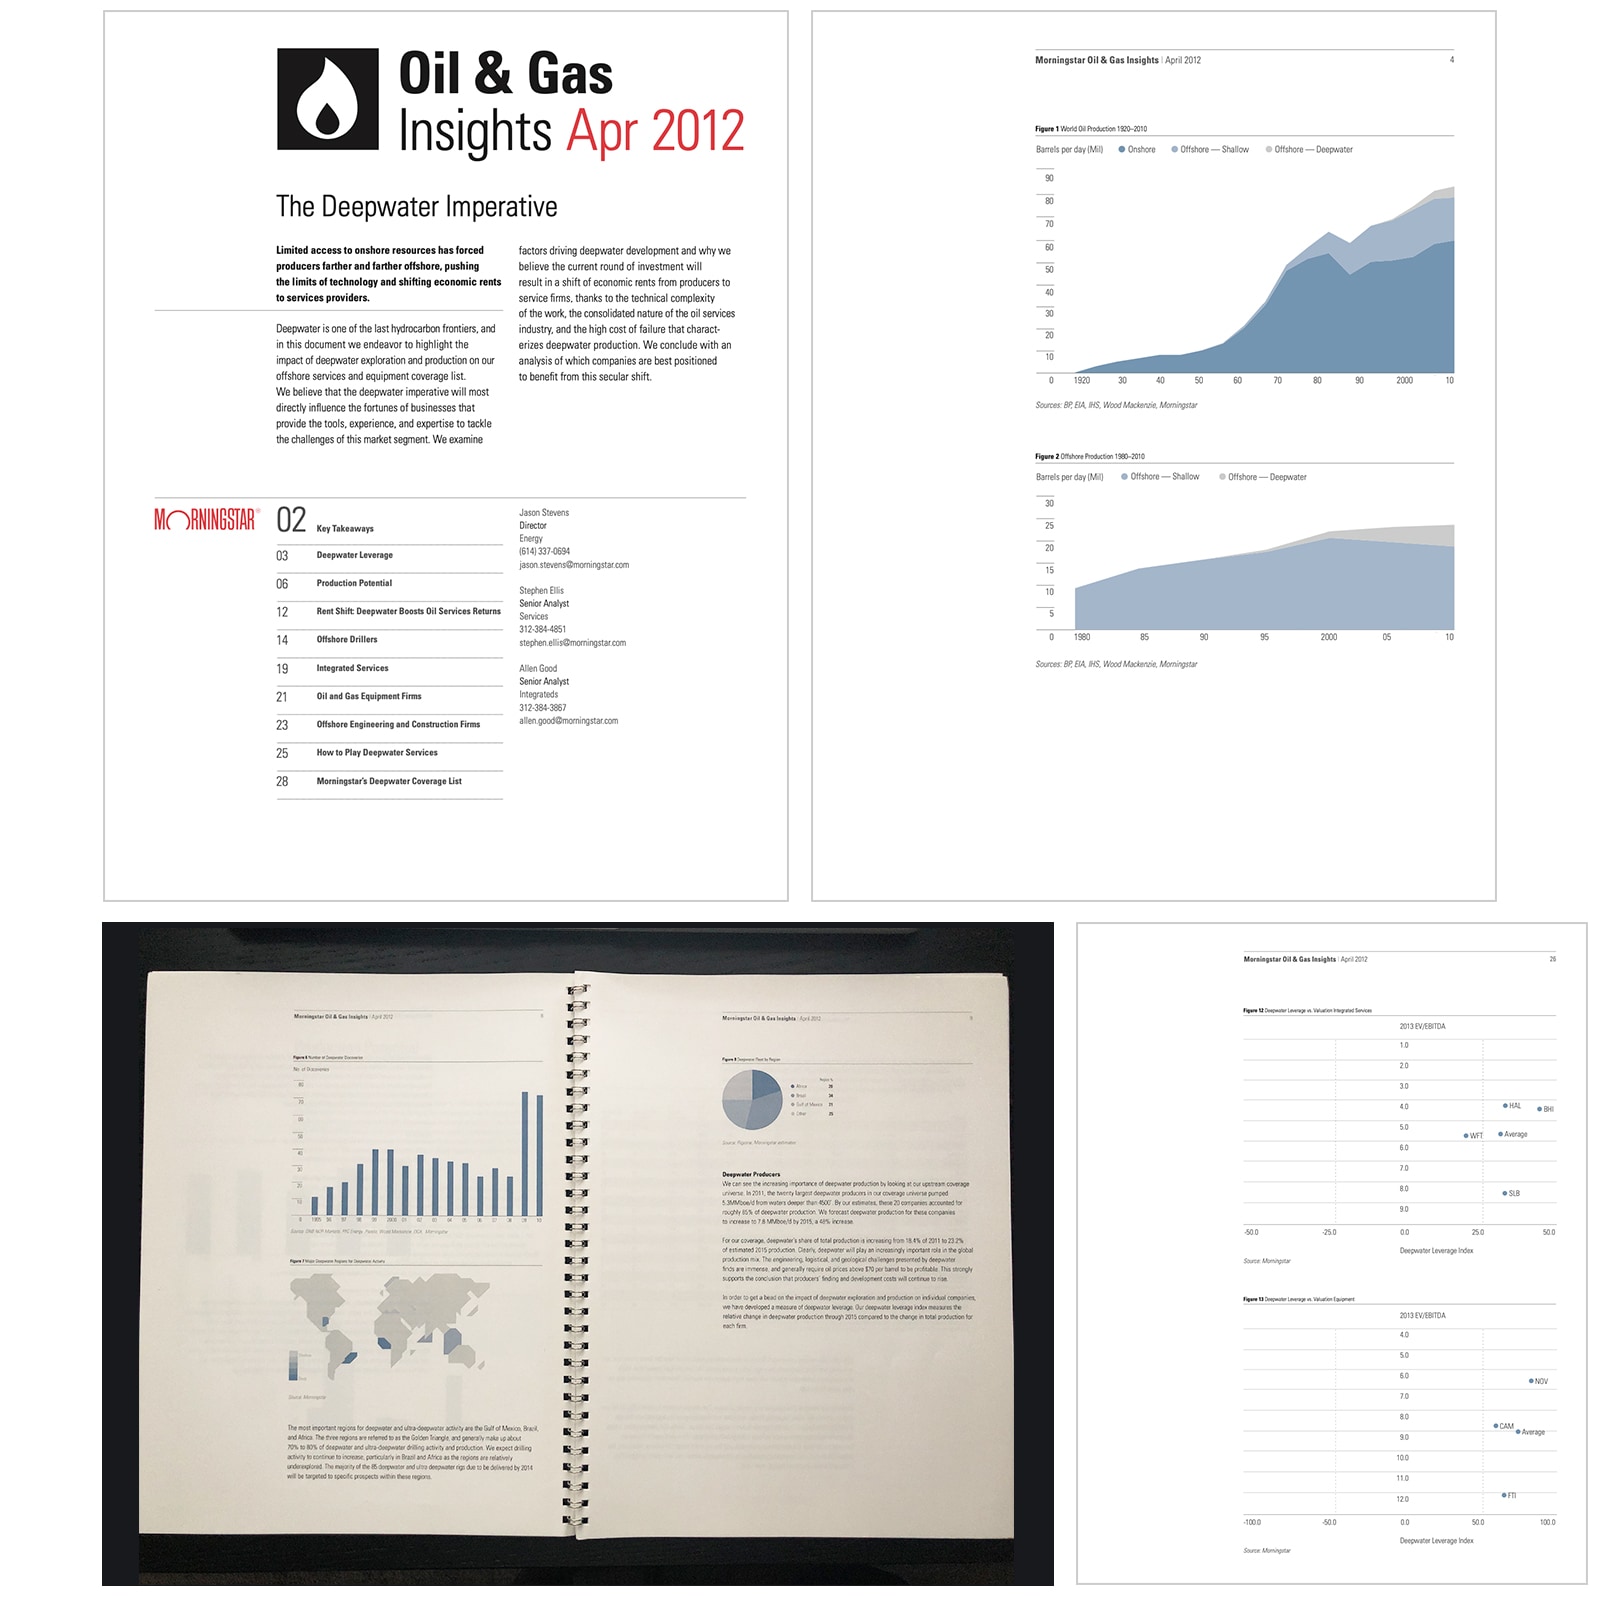
I managed data visualization and layout for the monthly Oil & Gas Insights report, consistently presenting new data in familiar ways.
Process
The system needed to be flexible and scalable for various data types.
I used InDesign data merge with Excel content to efficiently generate charts and graphs, visualizing data by context:
- For time-based data, use a bar or line graph
- For percentages, use a pie or donut graph
- For countries and locations, use our map graphic
- For complex or compounding data, use a table
- For spectrum, use a plot graph
Approaching it this way helped me visualize and design around the data.
Review, Iterate, and Publish
After team sign-off and Sectors team review, I iterated on layouts and exported the final PDF for clients.
Various One Sheets
Background
One sheets were widely used for bite-sized information. They offered a great opportunity to experiment with design and data visualization.
Scope
I designed numerous one sheets for events, portfolios, and more, using them to test new layouts and design approaches.